Using ACV as a KPI
2-min read
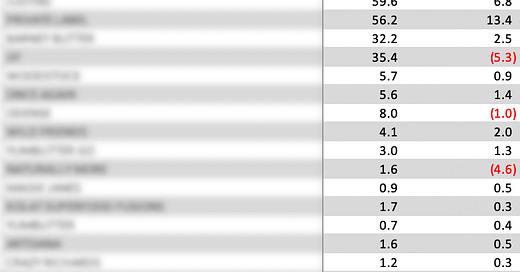
Last week I talked about the best way to grow distribution. I said you should saturate a market within a region instead of spreading yourself out nationally. The way to know you have saturated a market is through measuring your ACV%. You don’t need to buy data to approximate this percentage (I’ll explain in the last part of this post).
What is ACV?
ACV is a measurement of distribution. It stands for All Commodity Volume and is stated as a % because it is the ratio of actual stores selling your product to total stores. (There is store weighting involved in the calculation, which we won’t get into here). Investors and retailers use ACV% as an indicator of brand breadth. You will use it as a measure of market saturation.
ACV is time bound. When you state an ACV%, you are telling what % of stores have sold at least one unit in a period of time. I suggest using 4 weeks because you want to match up with velocity tracking – units per point of distribution – per week.
ACV can be measured by retailer or by region. You want to do both.
To illustrate, (this is simplified) if you are authorized to sell in all the stores of a certain retailer, you will filter for that retailer, and if at least one unit sold in all of those stores in the last 4 weeks, then theoretically your ACV% will be 100% (it never actually shows 100%, so figure high 90’s means 100%).
Then, if you are authorized to sell in 100 stores in the entire region, and the region has 1000 stores (again, simplifying), then your max ACV could only be 10%.
What is a good ACV%?
Ideally you want to be available and turning in all the stores you are authorized in. Barring an exception, like some stores that are part of a chain are very hard to get to and for efficiencies sake you’ve strategically allowed your merchandizers to skip them, I like to see that you are performing >90%.
For market saturation, I like to see that you are at 10% ACV in a region before moving on to conquer a new region.
Remember, just because you have a high ACV doesn’t mean you are a top seller, it just means you are selling, which means your product is available.
Now, what do you do if you don’t purchase this data?
Guesstimating ACV
You can approximate ACV by running distributor reports per retailer, at the store level, to see if your products are being ordered consistently. A couple caveats here: this is not a perfect method. Cases can be piling up in the back of a store skewing the numbers – but if you are doing store checks and you visibly see placement, you can be more confident that the store is ordering because product is moving through the register. My recommendation here is to use trended data over several periods to smooth out the ordering spikes and lulls that happen due to promotion buying. I would look at three consecutive 4-week periods of data at a minimum.
Next week, I will highlight brands that nail the market saturation game by creating a ton of anticipation ahead of their regional rollouts.
All my best,
Jennifer
__NEWS_____
The following stores will be divested by Kroger following the closing of the merger with Albertsons Cos. Store Brands
WA: 104 Albertsons Cos. and Kroger stores
CA: 66 Albertsons Cos. and Kroger stores
CO: 52 Albertsons Cos. stores
OR: 49 Albertsons Cos. and Kroger stores
TX/LA: 28 Albertsons Cos. stores
AZ: 24 Albertsons Cos. stores
NV: 15 Albertsons Cos. stores
IL: 14 Kroger stores
AK: 14 Albertsons Cos. stores
ID: 13 Albertsons Cos. stores
NM: 12 Albertsons Cos. stores
MT/UT/WY: 12 Albertsons Cos. stores
DC/MD/VA: 10 Harris Teeter stores


