

Ridiculous Predictions

The Business of Food
by Jennifer Barney
Ridiculous Predictions
2-min read
Investors will reject brands out of hand who make ridiculous predictions.
Or at least they should. Some hype is expected – founders will show optimistic outcomes and best-case scenarios. But the numbers have to be based on some semblance of reality.
A brand came to me recently with a plan to value their company at a number that represents 50% of the total category - a category that is growing in single digit CAGR. This is not a realistic market potential – and reveals a delusional vision of the addressable market.
One of the more frustrating things is reconciling that recent CPG IPOs have broken the rules on valuation. Beyond Meat trades at >17% projected revenues and is valued at almost 2X the global meat substitutes market. Oatly continued to climb on the NASDAQ to a $13b valuation earlier this year – a huge overreach given that the global plant based dairy market is predicted to total $21b six years from now.
When these things happen and no one says anything, it sends the wrong signals to startups.
Aggressive growth valuations are expected for brands that have real strategic advantages in hot categories (alt animal today, energy drink yesterday) and majority share can endure (note PepsiCo’s Gatorade still holds majority share of the global energy drink market) but most category leaders are less than 20% share of their categories.
How to be taken seriously by investors: accurately and honestly predict your brand’s market potential.
The market potential of a brand should be within the context of the addressable market.
Evaluate yours using these three approaches:
Bottom Up
Top Down
Household Penetration
Bottom Up
This is the most accurate and trusted way to predict your market potential because it is based on your current performance.
Show latest period velocities (units / store / week)
List out number of future stores
Apply velocities
For D2C
Show growth rate
New customer acquisition rate
Retention Rate (% repeat)
Project out
Top Down
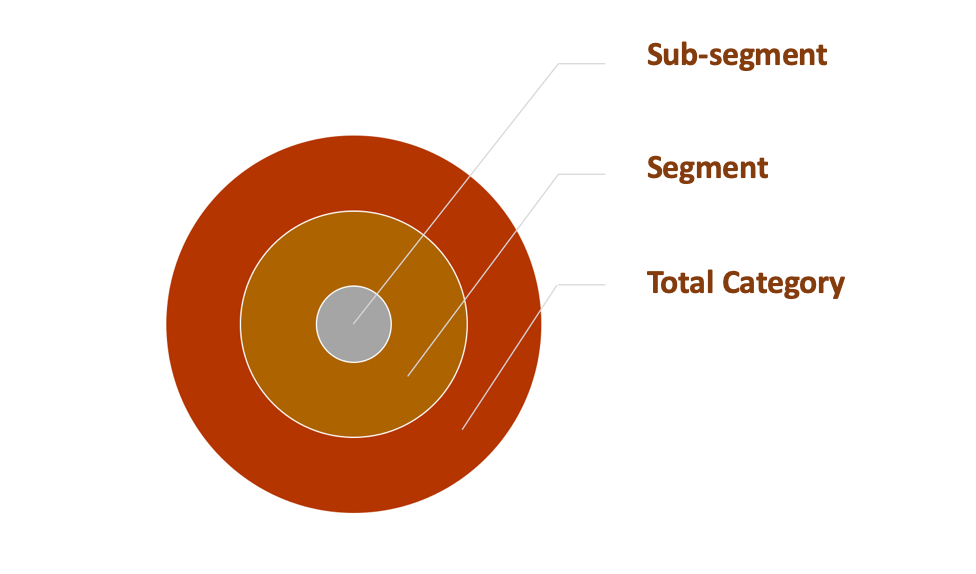
You’ve seen this concentric circle before. You want to show total category as the biggest circle, then a segment within that category next, and your sub-segment at the core. These should correlate to what Nielsen or IRI has coded as categories and segments.
But our products don’t fit any category – we’re totally new
A lot of brands want to say they are creating a category where none exists. While this may be the case in the future, for now syndicated data will code you somewhere that currently exists – which should be where you are being merchandized (on the physical or virtual shelf). Go with that. This approach supports your bottom up projections.
You can get category data from primary sources
Stackline or Junglescout for Amazon
or secondary sources
Market intelligence reports like Mintel
Trade publications like Food Navigator
Industry groups like Good Food Institute
Household Penetration
Household penetration refers to an approximation of the percent of total households that are users. It is an extrapolation based on panel data. You don’t have to get fancy Nielsen panel data to get usage and consumption rates. Commodity groups track volumes (shipments) and have studies on total household penetration, consumer purchases per month, and per capita consumption rates. Talk to your suppliers and get connected to their commodity reports.
Bottom line, your market potential has to be supported by facts.
Next up: what role do you play in the category?
All my best,
Jennifer
California agriculture grows:
> 30% of our country's vegetables
> 65% of our country's fruit and nuts

I'd love to hear from you - get in touch at jennifer@3rdandbroadway.com